The operation study
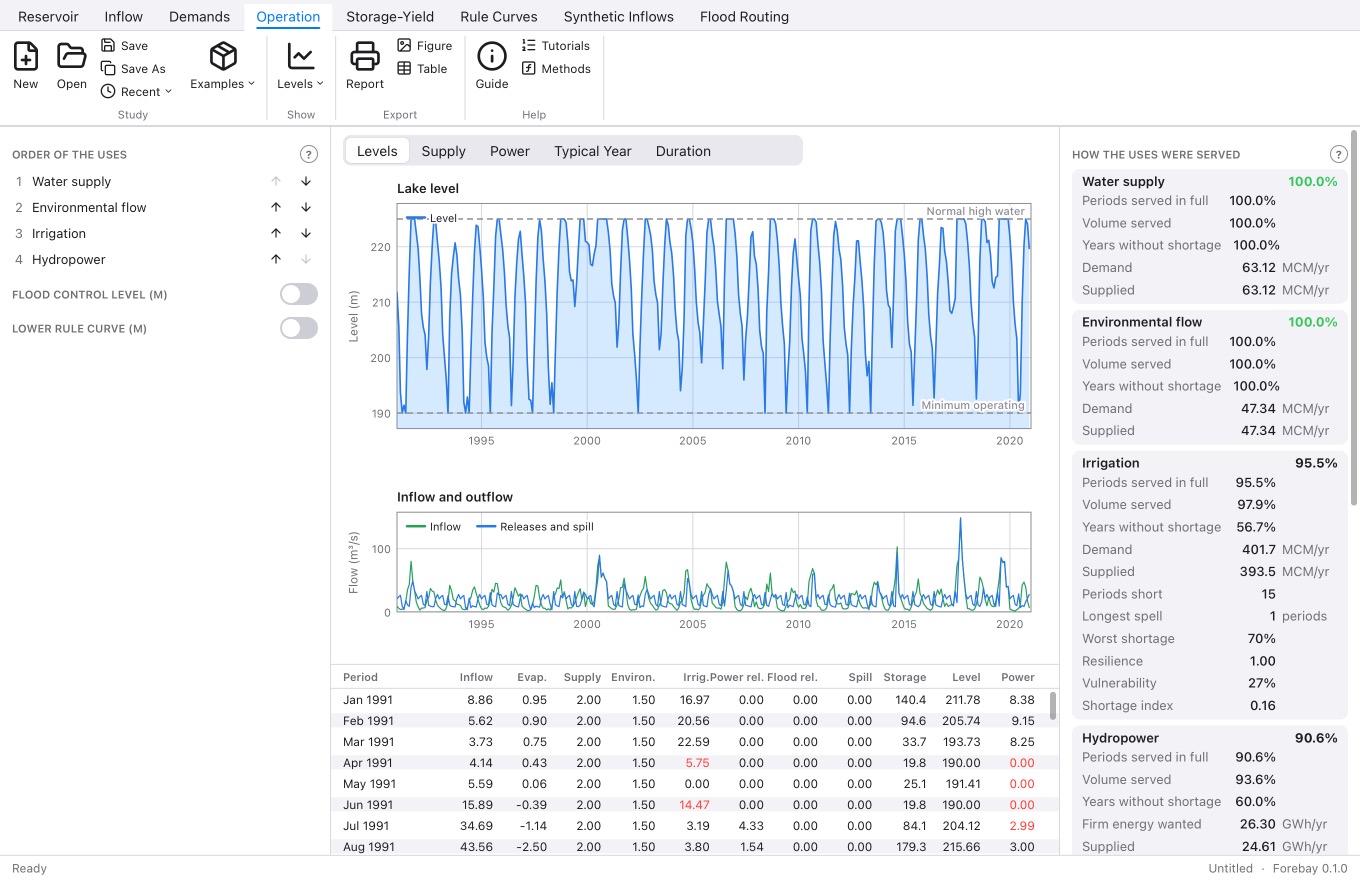
The lake's water balance period by period: inflow, rain, evaporation from the surface it has, seepage, releases and spill. It's worked out again as you type.

Give Forebay a reservoir, a record of the river that fills it, and the water people want from it. It plays the record through, period by period, as if the dam had been running all those years, and tells you how often the town, the farms and the power plant would have had what they needed.
One reservoir, four uses, five studies, at a monthly, ten-day or daily step.
The lake's water balance period by period: inflow, rain, evaporation from the surface it has, seepage, releases and spill. It's worked out again as you type.
Water supply, environmental flow, irrigation and hydropower. When water is short, the first gets all it wants before the second gets any. Move them up and down to see what changes.
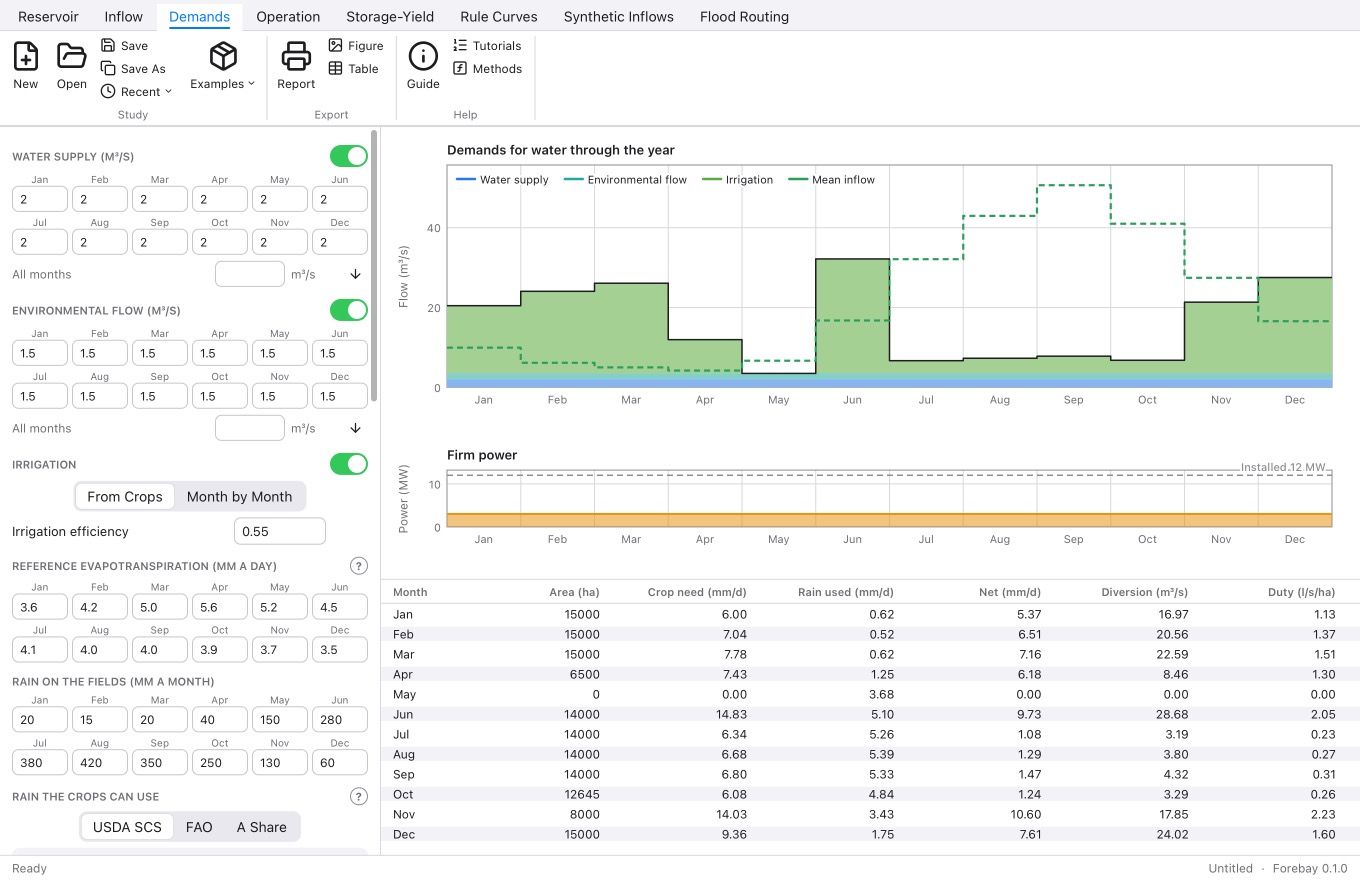
Or month by month. A cropping pattern with land preparation, FAO 56 crop coefficients, paddy percolation and three rules for effective rain gives the water to divert, and the duty.
Power from the releases that pass the turbines and from water that would spill, under the net head of the day. A firm power to keep up, with water released for it when needed.
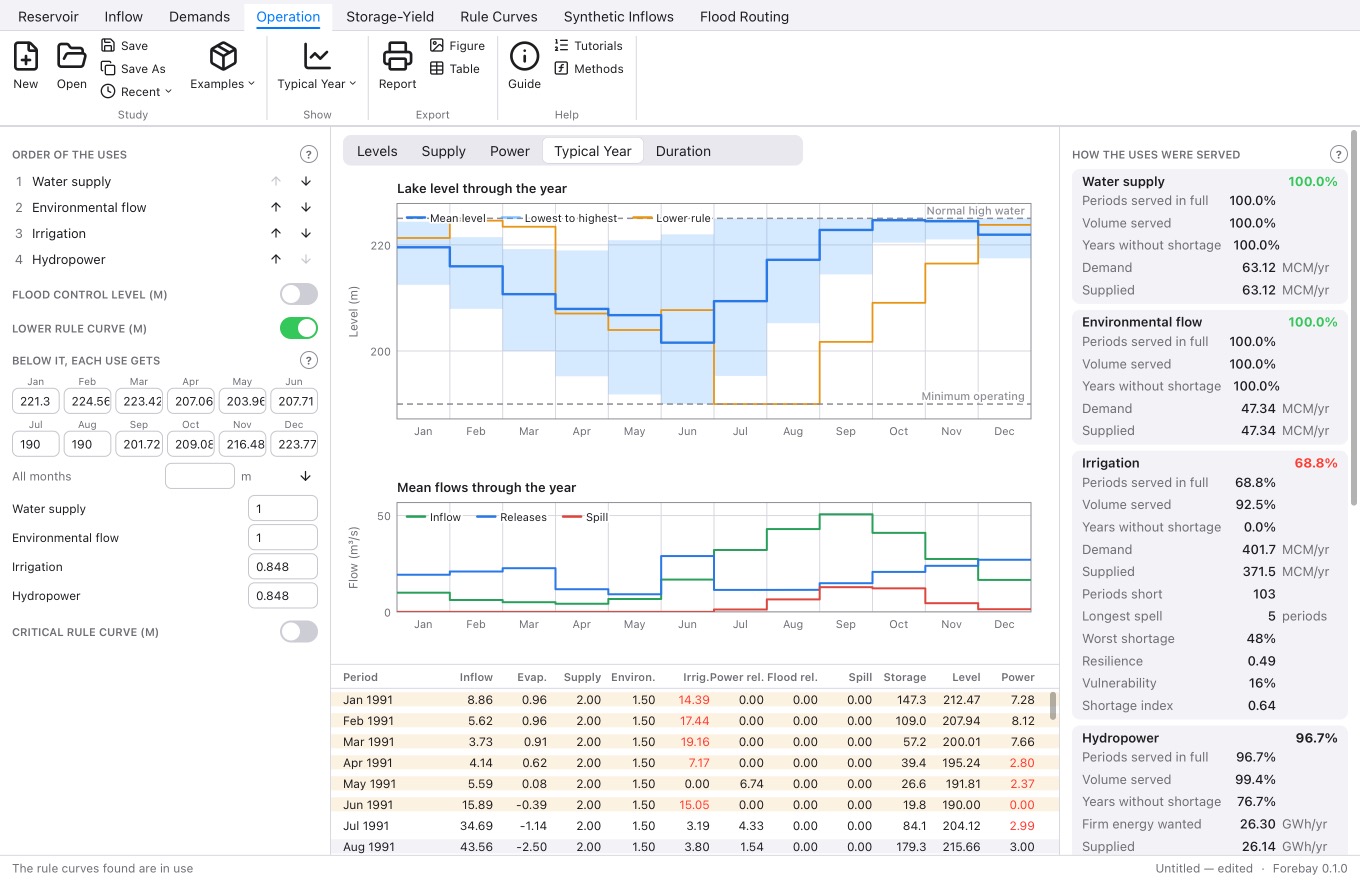
A flood control level, and lower and critical curves below which each use gets only a share. Many shallow cuts in place of a few deep ones.
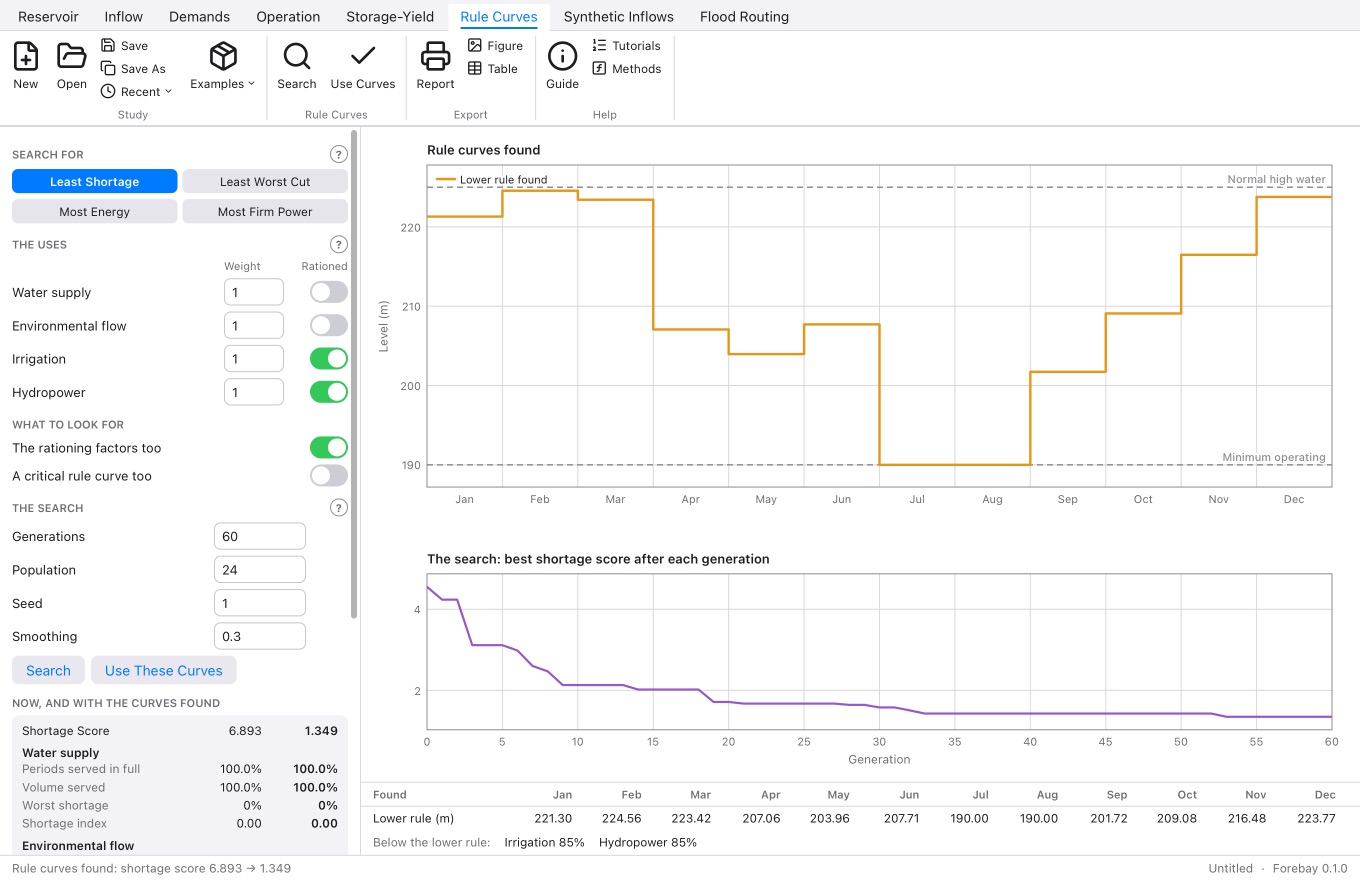
Differential evolution tries thousands of policies on the record: least shortage, least worst cut, most energy or most firm power. One click puts the best into the study.
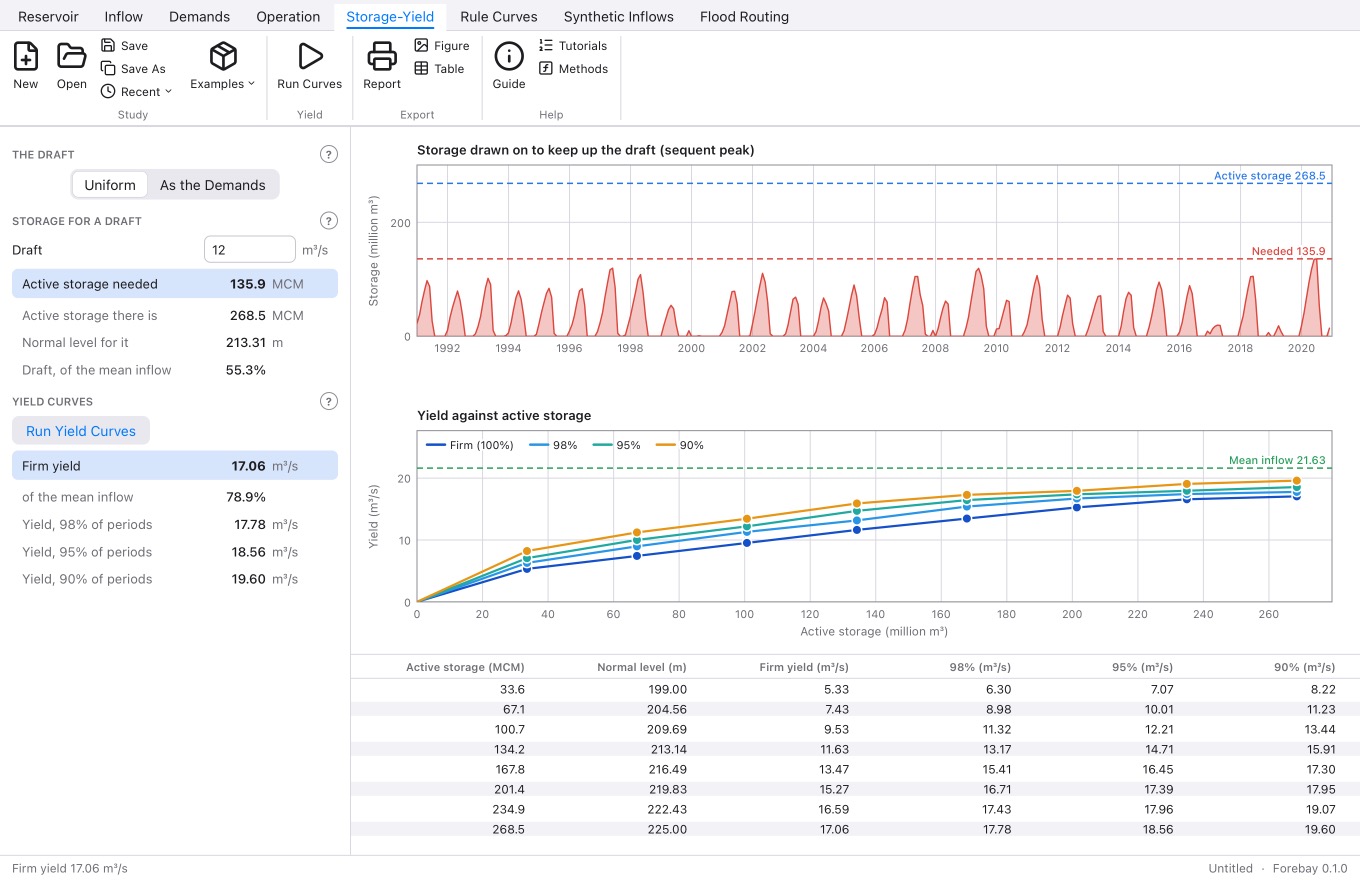
The sequent peak for a draft, the firm yield found by trial runs, and yield against storage at 100, 98, 95 and 90% reliability.
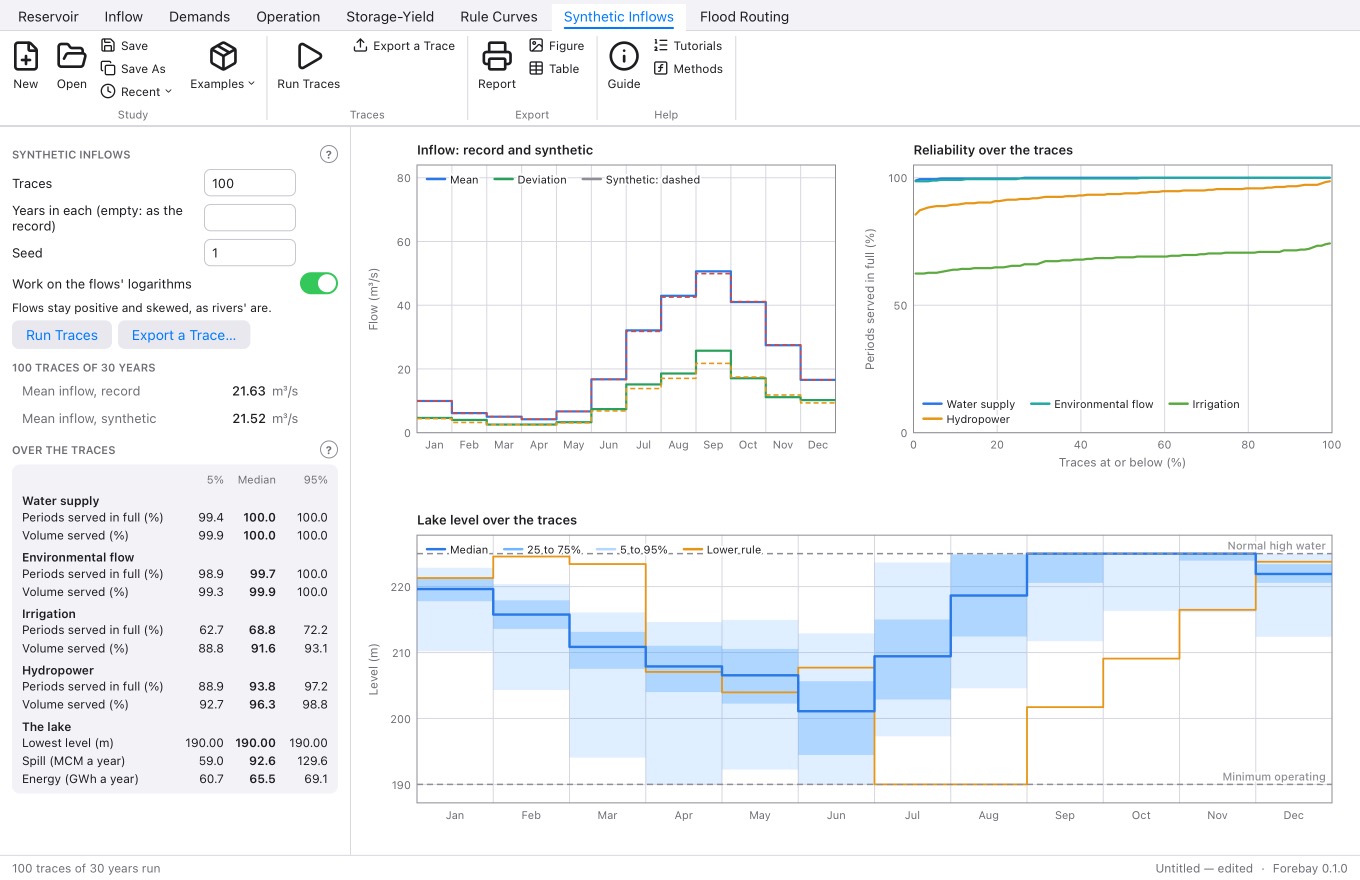
Records that might have been, with the record's statistics: Thomas-Fiering for monthly and ten-day flows, fragments for daily ones. The study over a hundred of them shows how much rested on one record.
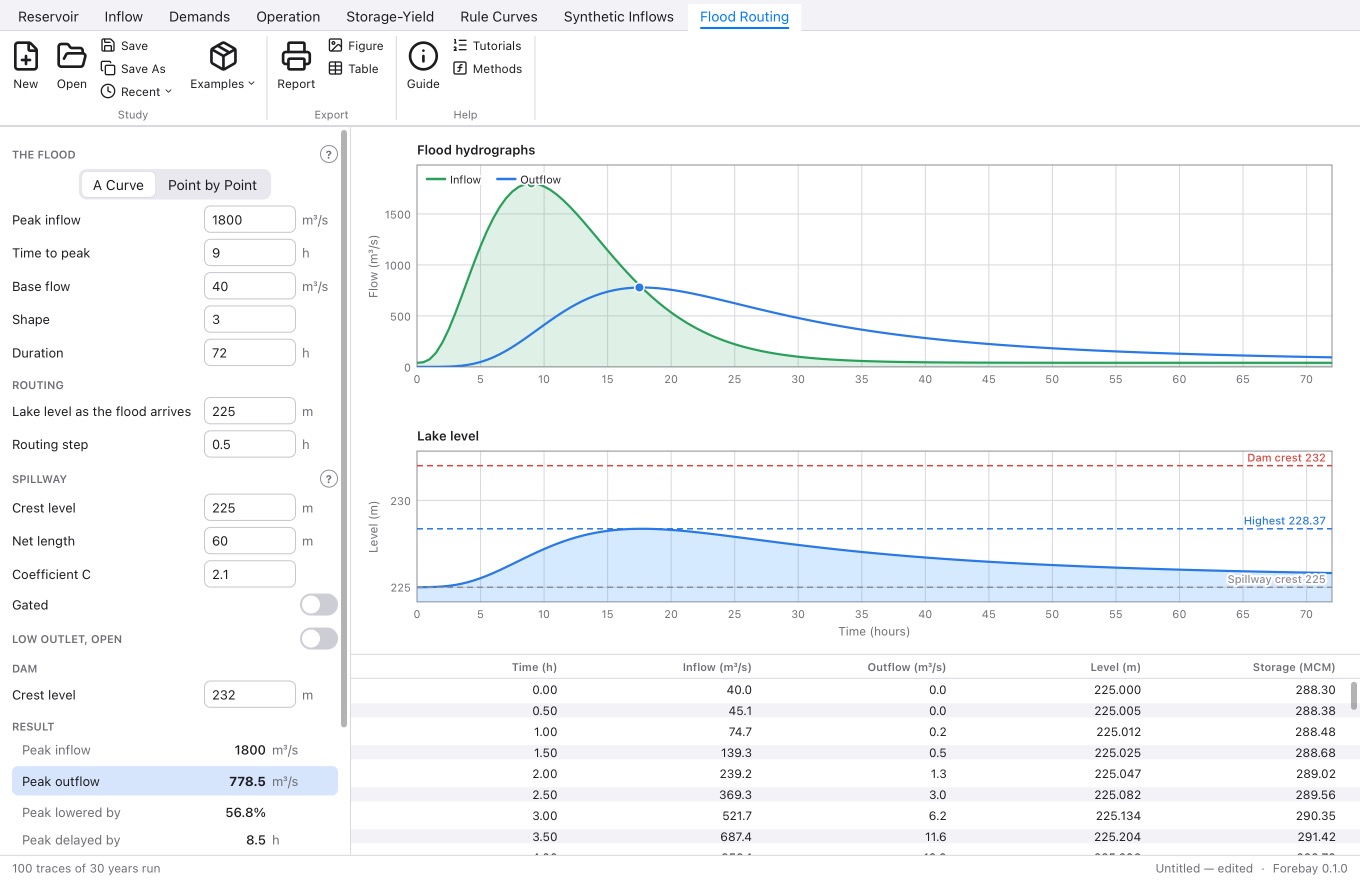
A flood through the lake by level pool routing, over an open or gated spillway and through a low outlet: the peak let out, the highest level and the freeboard left.
The whole study as a PDF, any figure as a picture, any table as CSV. A guide with three tutorials, and its methods and limits, are built in.
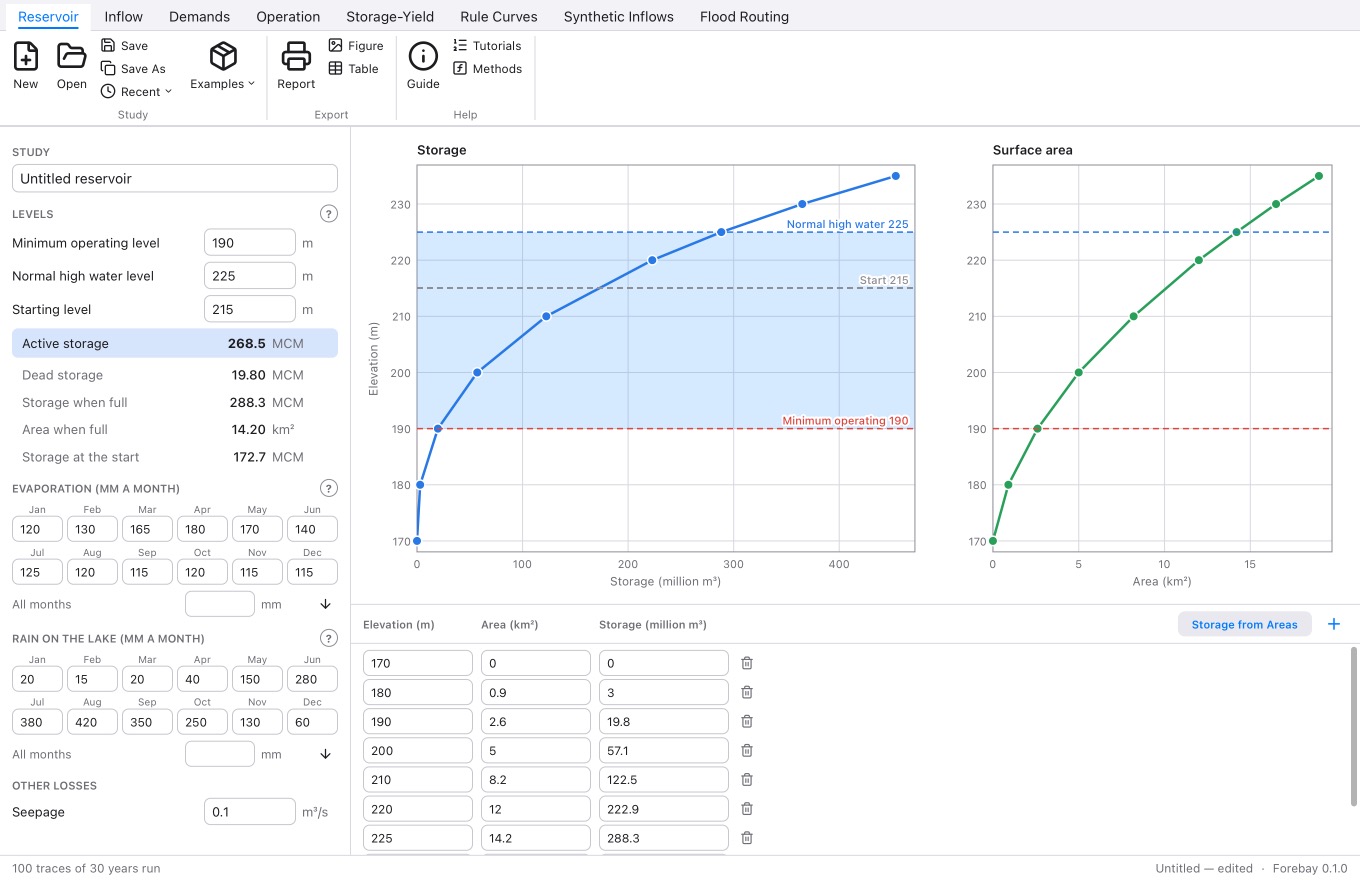
Its elevation-area-storage curve, typed in or worked out from areas, the minimum operating and normal high water levels, and what the lake loses to evaporation and gains from rain, month by month.
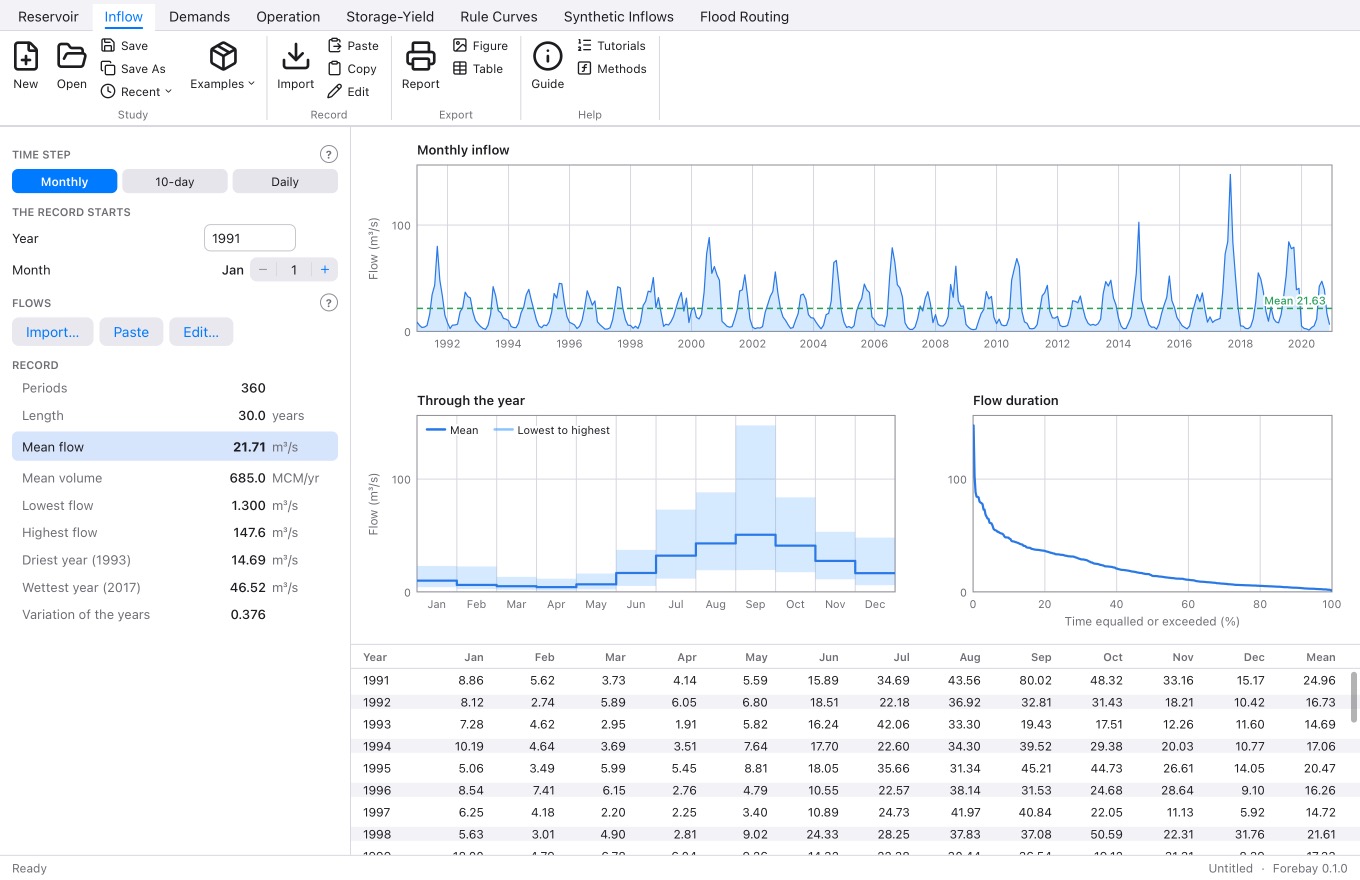
Import a CSV, paste from a spreadsheet, or drop a file on the window: a year of months to a line, a date and a flow, or the flows alone. The record through time, through the year, and its duration curve.
Two crops of rice a year, a town and a stream left flowing, stacked against what the river brings. The dry-season crop asks for two to four times what the river brings: the reservoir has to make up the rest.
Run as it is, the lake is drawn to its minimum and irrigation's worst month is 70% short. The search finds a curve that rations early in the dry season: the worst cut falls to 47%, and the firm power holds in 97% of months.
With the curve in use: the lake's level at each time of year, from its lowest to its highest, the curve beside it, and the mean flows in and out. Shaded rows of the table are the months that started below the curve.
A hundred synthetic records of thirty years, each run through the study. The table gives the result one record in twenty did worse than; the bands show where the lake stood.
The storage a draft needs by the sequent peak, and the yield the reservoir keeps up at each size and reliability. Here the last third of the storage adds little.
A flood of 1800 m³/s arrives with the lake full. Over a 60 m spillway the peak let out is 779 m³/s, eight and a half hours later, and the lake rises 3.4 m: 3.6 m below the dam's crest.
Standard methods, set out in the app's guide with their equations and sources.
| Part | Method |
|---|---|
| Operation studyeach period worked out three times, for evaporation and head | Water balance, uses served in their order |
| PerformanceHashimoto, Stedinger and Loucks (1982) | Reliability, resilience, vulnerability, shortage index |
| Crop water demandAllen and others (1998), FAO 56 | Kc × ETo, land preparation, percolation |
| Effective rain | USDA SCS, FAO dependable rain, or a share |
| Storage for a draftrun twice over the record | Sequent peak |
| Yield | Bisection over runs of the operation study |
| Rule curve searchStorn and Price (1997) | Differential evolution, DE/rand/1/bin |
| Synthetic inflowsThomas and Fiering (1962) | Seasonal lag-one model, on logarithms; daily by fragments |
| Flood routingChow, Maidment and Mays (1988) | Level pool, storage equation solved for each step |
Every calculation is checked against hand calculations each time the app is built: the water balance step by step, rationing, power, the sequent peak, crop demand, the spillway and the statistics of synthetic records.
The Examples menu opens studies ready to run. Change them to see what matters.
An engineer should know where a tool stops. Forebay says so in its guide, and here.
Forebay is an aid to an engineer's judgment. Check its results against your own before relying on them.
Forebay runs on macOS, with Windows to follow.